Introduction
Given the rapidly increasing role Photogrammetry is taking in the recording of archaeological sites, it is worth exploring the distinct advantages that this technology brings to the recording of artefacts (Allen et al. 2004). Although a methodology for acquiring 3D data from objects has been previously established by a number of scholars, research into the wide plethora of applications this data allows is still in its infancy (Pollefeys et al. 2002; Forte and Kurrillo 2010; Westoby et al. 2012; Olson et al. 2013).
Over the course of the excavation carried out at Ham Hill, Somerset, during the 2013 season, a number of fragmented decorated vessels were found on the outskirts of an Iron Age enclosure. One of the ideas suggested at the time of discovery was the possibility of using Photogrammetry to “stitch together” the different parts, to see if it was possible to recreate the vessel digitally, as if it had been physically glued back together.
In part, this was guided by three principles: 1. Research questions concerning the refitting of pot sherds across the site, and the contribution that digital reconstruction could potentially offer; 2. Conservation, and the desire not to add glue to sherds prior to additional scientific analyses. 3. Visualisation – first to provide a means to present pottery to specialists during the excavation (i.e. on-going informative feedback during fieldwork), and second, as a presentation tool for broader outreach.
This paper is a summary of the methodology adopted, which will be referred to as ‘Photogrammetric Pottery Reassembling (PPR)’, and as a showcase of the results.
About the pots
The four pots reassembled digitally were found during the 2013 excavation of the site of Ham Hill, Somerset. The site is located outside a Mid to Late Iron Age enclosure, which was previously excavated in the 2011 and 2012 campaigns (Slater et al. 2012; Brittain et al. 2013). The peak of occupation of the area appears to be the Mid to Late Iron Age, with a number of ditch defined dwellings, and post structures with multiple clusters of pit grain stores associated with this phase.
Two of the pots found were located in a pit rich in finds, including loom weights and ironwork, while the other two were found in a nearby ditch, cut by, but broadly contemporary with, the main enclosure. The pots themselves were only partial and fragmented, yet in relatively good conditions. They were given individual finds numbers and 3-D located using an Electric Distance Meter (EDM).
The reason these pots were chosen to test this methodology was to ensure the safety of the fragments, which would not have benefited from being glued together due to their fragility. In addition to this, three of the pots contained decoration, so one of the aims of this project was to find out if it was possible to emphasise this decoration digitally.
Additionally, the number of fragments was key to this choice, as they range from three to nine shards, making it possible to test the method without putting a strain on the programs used. The actual limits in fragments is hard to define, as it depends on the size and quality of the models, but even with nine fragments the program started having computational issues.
Programs and Photogrammetry methodology
Photogrammetry was chosen over Laser Scanning, as it is more cost effective and thus more accessible.
The programs used to reassemble the pottery were 123D Catch and Blender, both of which are freeware. 123D Catch was used to create the original mesh from photographs through the use of Photogrammetry. Although the results here were achieved using solely 123D Catch, similar results can be obtained using any Photogrammetric program of choice, provided that this allows exports in .obj format. Blender is also a freeware program that was used to stitch the different fragments together. Meshlab was originally used, but proved to be unreliable.
The individual fragments were photographed and then made into models with 123D Catch. Each fragment was photographed from 17 different angles, completing two full circles around the object with a 45 degree shift from one position to the other, and with a difference in height between the two circles. A final photo was taken as bird’s eye view. 123D Catch does not require calibration for the cameras, making it possible to simply estimate where the camera would be rather than having to measure the distances accurately. In order to further simplify the process, an automatic setting was used on the camera, which recorded them in a fine .jpeg format.
The use of a brightly coloured surface, with faintly recognisable bumps to increase the noise, was useful in improving the accuracy of the models. In the case of this project a bright blue plastic base, originally a TV stand, was used with good results, as the contrast between the pottery and the bright base was substantial. This, however, did cause blue “staining” on the texture, an issue addressed below.
First step: individual model creation
The initial phase of this method was to identify the fragments of pottery that were originally joined together. As the stitching of the individual parts has to be done manually, and scaling is an issue, defining beforehand which fragments would eventually form the vessel meant that the process was quicker and more accurate. This was done by placing the fragments on a surface, roughly in their position, and then taking a photograph for reference.
Each pot fragment was photographed and made into a model using 123D Catch, applying the maximum rendering settings. The sherd was carefully removed from its background by selecting portions of the latter and deleting them using the 123D Catch tools. It was then exported as an object file, with extension .obj. This resulted in three separate files in the folder, the actual .obj file that contains the information regarding the point coordinates, a .mtl file that pinpoints the position in which the textures are to be placed within the model, and a .jpeg image file, which represents the actual textures.
Second step: from parts to the whole
Once the individual pot fragments were created, the models were reassembled to recreate the complete pot. The first fragment was imported in Blender, and a few lights were created in order to increase visibility. The fragment was then positioned so that it would fit in with the rest of the vessel. As this was the first piece to be imported, and due to the relative dimension nature of Blender, it was not necessary to scale it.
After the first fragment was in place, the successive one was imported as before. This was then moved into the position and scaled using the first sherd as a reference. The main issue with the precision of the method is visible here as the scaling and positioning requires a level of guesswork. Switching between textured and un-textured mode proved to be of some use in this case, but although visually the results seem compelling, the accuracy suffers somewhat. Further observation on this issue will be discussed in detail below.
Once the second fragment was positioned using the Blender tools, the other sherds were also uploaded. Larger models (more than 130,000 points in this case) caused computational problems, but switching to non-textured mode seemed to ease the pressure.
Third step: final editing and rendering
Once all fragments were positioned, the textures were altered so they would appear more uniform. The first concern was some blue edges that had appeared on a few fragments due to the background used in the photographs. Using the colour selection tool these were corrected using the texture just next to it as a reference.
Similarly, the texture of some of the fragments was adjusted to provide consistent lighting, as the associated models were too light or dark due to the conditions in which the photographs were taken.
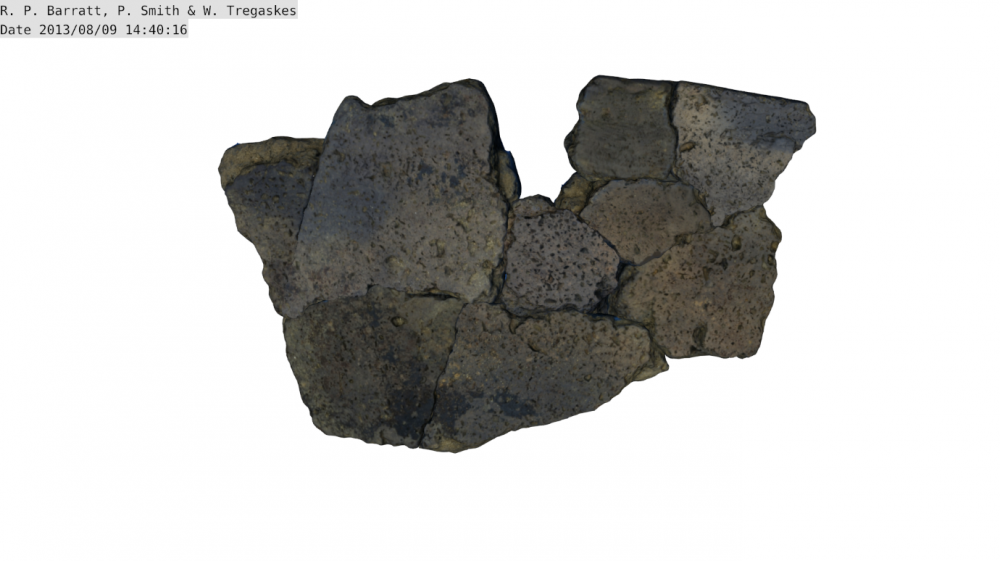
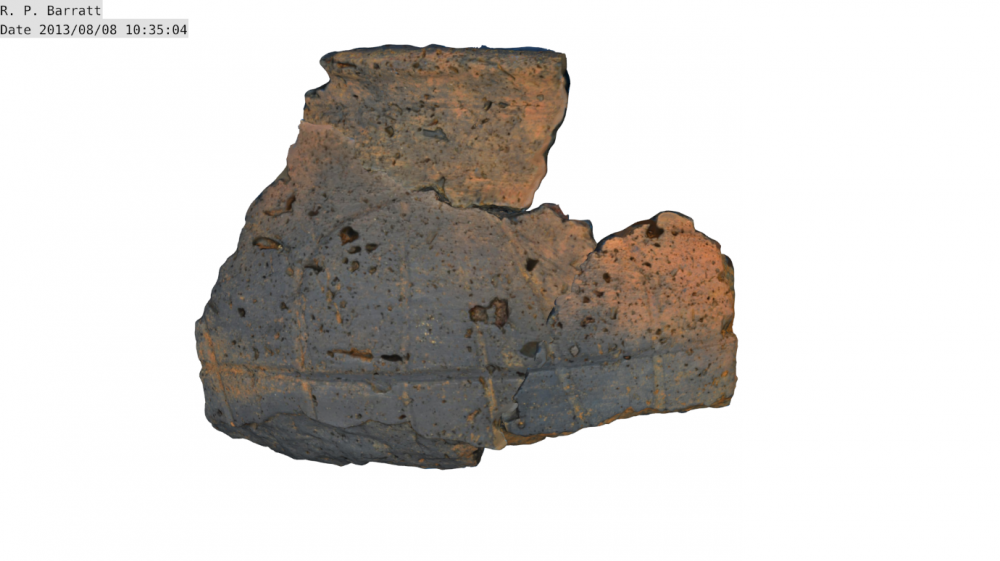
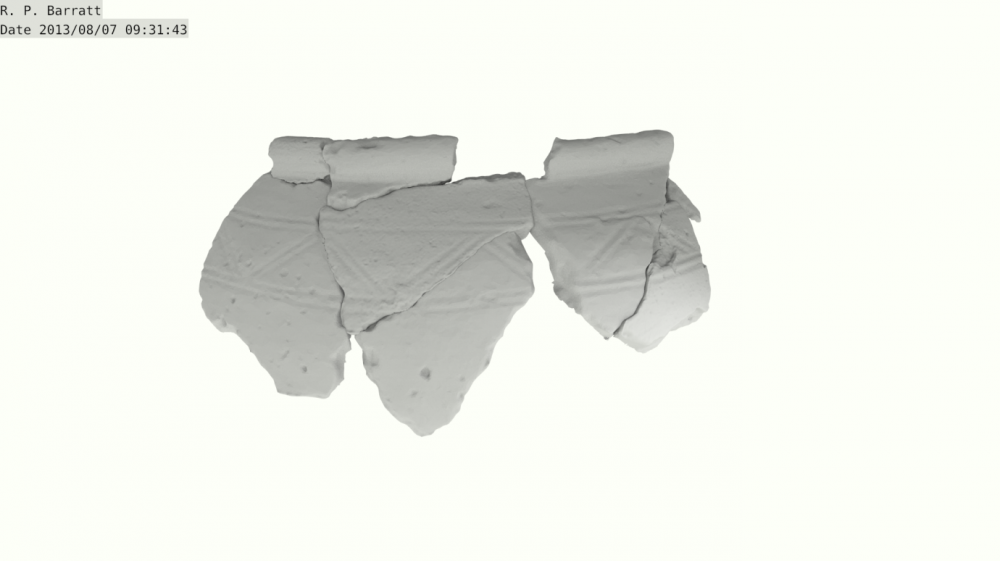
Once the textures were relatively attuned, the camera was positioned for the final rendering. The result was a series of 2D images, some of which are found in the appendix. A series of 2D un-textured images were also produced for some of the vessels, as the shades of white effect allowed some of the decorations to become more visible (see fig.4).
Uses of PPR
The methodology used to reconstruct these pots has a number of applications within the world of archaeology.
First and foremost, it allows the user to reconstruct a pot in digital form that might otherwise have to be glued together, a process which can be harmful to the vessel itself or that could impede further scientific analysis.
Another important aspect of this method is that the finished product is also a fully interactive 3D model. This can be made available to the general public through a number of ways, often creating proper galleries of artefacts that people can virtually explore. A good example of this is the website http://www.sketchfab.com, which allows delicate objects and transient archaeological features and sites to be more accessible. Also, models can be easily shared using 3D PDFs, which require little space and can be uploaded to websites with ease.
However, this method is also a good indicator of some of the other things Photogrammetry can do for archaeology. First of all, it shows how it is possible to digitally catalogue artefacts, and how this can be an accurate exercise with great potential regarding accessibility to the public, the research community and other archaeological practitioners. Secondly, merging multiple models can prove advantageous to field archaeology recording. Each feature excavated could be made into a model, and then the entirety of a site could be recreated by stitching the individual models together.
Finally, through the use of a 3D printer, the model that has been created could be replicated as a separate entity. As an addition, using software such as Maya by Autodesk, the rest of the pot (if it is not complete) can be reconstructed, hence making a tangible vessel out of a number of fragments.
Observations
Having access to the original fragments while stitching them digitally provided a valuable comparison that greatly increased the accuracy of the final product. Although the pots shown here were reconstructed only in the exterior, it would be entirely possible to reconstruct the other side of the vessel as well, making two separate models for either side.
Finally, a number of alternative programs may be used to achieve the same goals. For example, Agisoft Photoscan or VisualSFM (especially for Mac) can easily replace 123D Catch, and Meshlab can be used instead of Blender, although it does have some issues with stability.
Limitations
Given the experimental nature of this project, the results do carry some limitations, especially with regards to accuracy. As no reference scale was employed, each fragment had to be manually adjusted. This meant that although visually compelling, the results are subjective and imprecise. Other programs may provide solutions for this, and the addition of a consistent scale within the models themselves can greatly increase the scientific value of the results. Consistency between the fragments also generated some concerns since editing the textures taints the objectivity of the models. A solution to this is improving the photographic conditions, especially with regards to lighting.
Conclusion
Although this method has room for improvement, ‘Photogrammetric Pottery Reassembling (PPR)’ is an interesting approach to digitally reconstructing objects from fragments. It boasts a wide range of applications, both for artefact and field recording, which go beyond mere visual effects. It could help bridge the gap between researchers and general public, by creating digital spaces where people can view and interact with archaeological artefacts.
The methodology described demonstrates the flexibility of Photogrammetry. From the initial passive approach of simply collecting data, we have moved on to a new area of research, in which interaction with the data itself can provide valuable insight into a wide range of archaeological queries. And with the advancement of computing, these possibilities will only increase, hopefully giving us a broader understanding of archaeology as a whole.
Acknowledgments
The author would like to thank Marcus Brittain, Niall Sharples, Hayley Roberts and Laura James for their suggestions and time, and Paul Smith and Will Tregaskes for their help.
Reference list:
- Allen, P., Feiner, S., Troccoli, A., Smith, B., Benko, H. and Ishak, E. (2004). Seeing into the Past: Creating a 3D Modeling Pipeline for Archaeological Visualization. 2nd International Symposium on 3D Data Processing, Visualization, and Transmission : proceedings : 6-9 September, Thessaloniki, Greece.
- Brittain, M., Evans, C. & Sharples, N. (2012). Excavations at Ham Hill, Somerset (2012). Cambridge: University of Cambridge. p16-17.
- Forte, M. and Kurillo, G. (2010) Cyberarcheology - Experimenting with Teleimmersive Archeology. 16th International Conference on Virtual Systems and Multimedia, Oct. 20-23, 2010, Seoul, South Korea.
- Olson, B. R., Placchetti, R. A., Quatermaine, J. and Killebrew, A. E. (2013). ‘The Tel Akko Total Archaeology Project (Akko,Israel): Assessing the suitability of multi-scale3D field recording in archaeology’. Journal of Field Archaeology. 38 (3), p244-262.
- Pollefeys, M., Vergauwen, M., Cornelis, K., Tops, J., Verbiest F. and Van Gool, L. (2002). Structure and Motion from Image Sequences. Proc. Conference on Optical 3-D Measurement Techniques V, Grün, Kahmen (Eds.), pp. 251-258, Vienna, October, 2001.
- Slater, A., Brittain, M., Evans, C. and Sharples, N. (2011). Excavations at Ham Hill, Somerset (2011). Cambridge: University of Cambridge.
- Westoby, M., Brasington, J., Glasser, N., Hambrey, M. and Reynolds, J. (2012). ‘‘Structure-from-Motion’ Photogrammetry: A Low-cost, Effective Tool for Geoscience Applications’. Geomorphology 179 (1), p300–314.
Appendix